TradingView: Charts, Analysis, and Market Tools Facts
TradingView is an online platform for viewing financial charts, researching markets, and analyzing price movements.
It is used by many traders and investors to study assets such as stocks, cryptocurrencies, forex pairs, futures, and exchange-traded funds.
The platform combines charting tools, market screeners, price alerts, news feeds, and community-published ideas. It can be useful for market research, but it does not guarantee profits or remove the risks involved in trading and investing.
What TradingView Offers
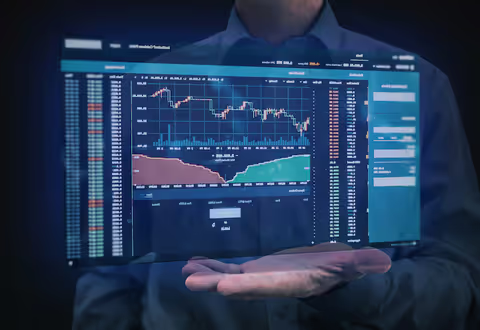
TradingView is best known for its interactive charts. Users can view price movements across different timeframes, apply technical indicators, draw trendlines, and compare multiple assets on one screen.
The platform also provides market data, watchlists, screeners, and alerts. Depending on the asset and region, some market data may be delayed or require a paid subscription.
Charting Tools
Interactive Charts
TradingView charts allow users to examine price history and market activity. Users can choose chart types, adjust timeframes, and zoom in on specific periods to study price behavior.
The platform includes multiple chart styles, drawing tools, and technical indicators. These tools can help users organize their analysis, but they do not predict future prices with certainty.
Indicators and Drawing Tools
Technical indicators are calculations based on price, volume, or other market data. Common examples include moving averages, relative strength indicators, and volume-based tools.
Drawing tools let users mark support and resistance areas, trendlines, patterns, and price levels. These visual aids can support a trading plan, but interpretations can differ from one person to another.
Multi-Chart Layouts
Some plans allow users to view more than one chart in a tab. This can help traders compare related assets, such as a stock index and its component stocks, or a cryptocurrency pair across different timeframes.
The number of charts, indicators, alerts, and historical data bars available depends on the subscription plan.
Market Screeners
TradingView includes screeners that help users filter assets based on selected criteria. For example, a user may look for stocks with particular valuation or performance characteristics, or cryptocurrencies meeting certain market conditions.
Screeners can display results as data tables or visual charts. They are research tools, not recommendations; a filter may identify assets that meet chosen criteria, but it does not confirm whether an asset is suitable for a particular person.
| Tool | Main purpose |
|---|---|
| Charts | Study price movement and market behavior |
| Indicators | Apply calculations to market data |
| Screeners | Filter assets using selected criteria |
| Alerts | Receive notifications when conditions are met |
| Watchlists | Track selected assets in one place |
| Paper trading | Practice strategies using simulated funds |
| Community ideas | View analysis and commentary from other users |
Alerts and Watchlists
Alerts can notify users when a price reaches a chosen level or when a technical condition occurs. This can help users monitor markets without watching charts continuously.
Watchlists allow users to organize assets they want to follow. A trader may group stocks by sector, while an investor may track long-term holdings or potential research ideas.
Alerts should not be treated as automatic trading signals. Users still need to consider market conditions, position size, risk tolerance, and their own investment goals.
Paper Trading
Paper trading, also called demo trading, lets users practice buying and selling using virtual funds rather than real money. It is designed to help users test strategies in conditions that resemble live markets.
Users can place, modify, and close simulated orders directly on charts. The platform tracks orders and positions, which can help users review how a strategy performs over time.
Paper trading can be useful for learning platform features and testing ideas. However, simulated results do not guarantee similar results with real money because real trading involves emotions, liquidity conditions, fees, and execution differences.
Broker Connections
TradingView can connect with certain brokers and cryptocurrency exchanges, allowing eligible users to place trades from the platform. Availability depends on the user’s country, account type, and the connected service.
Before connecting a brokerage account, users should review the broker’s terms, fees, security practices, and available markets. Trading through a third-party platform does not remove the need to understand the risks of the underlying asset.
Community and Learning
TradingView includes a community section where users can publish charts, analysis, scripts, and market ideas. This can expose users to different viewpoints and charting approaches.
Community content is not professional advice. Anyone can publish an idea, and a chart or prediction may be incorrect. Users should verify information independently and avoid copying trades without understanding the reasoning and risks.
Plans and Costs
TradingView offers a Basic plan along with paid subscription tiers. Paid plans generally provide additional features such as more charts per tab, more indicators per chart, more alerts, and greater historical data access.
The right plan depends on how often someone uses the platform and which tools they need. Casual users may find the free plan sufficient for basic chart viewing, while active traders may need more advanced charting or alert features.
Risks to Understand
Trading and investing involve risk. Prices can move quickly, markets can be volatile, and losses may exceed expectations, especially when leverage or borrowed funds are involved.
Users should avoid treating any chart pattern, indicator, alert, or community idea as a guarantee. A responsible approach includes setting a budget, understanding fees and taxes, avoiding emotional decisions, and seeking qualified financial advice where appropriate.
Frequently Asked Questions
Is TradingView free?
TradingView offers a Basic free plan with limited features. Paid plans provide additional charting, alert, screener, and data capabilities, with availability varying by region and plan.
Can I trade real money on TradingView?
Yes, eligible users can connect supported brokers or crypto exchanges and trade through the platform. Availability and supported assets depend on the connected service and the user’s location.
What is paper trading?
Paper trading is simulated trading using virtual funds. It allows users to practice placing and managing trades without using real money.
Does TradingView give trading advice?
No. TradingView provides tools, market data, charts, and community content. It does not provide personalized investment advice or guarantee trading outcomes.
Is TradingView suitable for beginners?
It can be useful for beginners who want to learn charting and practice with paper trading. Beginners should start with small, well-understood strategies and avoid risking money they cannot afford to lose.
Conclusion
TradingView is a market-analysis platform that brings together charts, indicators, screeners, alerts, watchlists, and paper trading. It can help users research markets and organize their trading process.
Its value depends on how it is used. Careful research, realistic expectations, risk management, and independent decision-making remain important for anyone participating in financial markets.
Disclaimer: The information provided in this article is for informational purposes only. We do not make any claims or guarantees regarding the accuracy, reliability, or completeness of the information presented. The content is not intended as professional advice and should not be relied upon as such. Readers are encouraged to conduct their own research and consult with appropriate professionals before making any decisions based on the information provided in this article.

Related Post...

Fidelity Investments: A Beginner’s Guide to Brokerage Accounts, ETFs
Updated: November 18, 2026
Read More
Exploring Growth Investing Strategies: Targeting Companies with Strong Future Potential
Updated: October 22, 2026
Read More